
Key Insights to Learn from WebAR Analytics
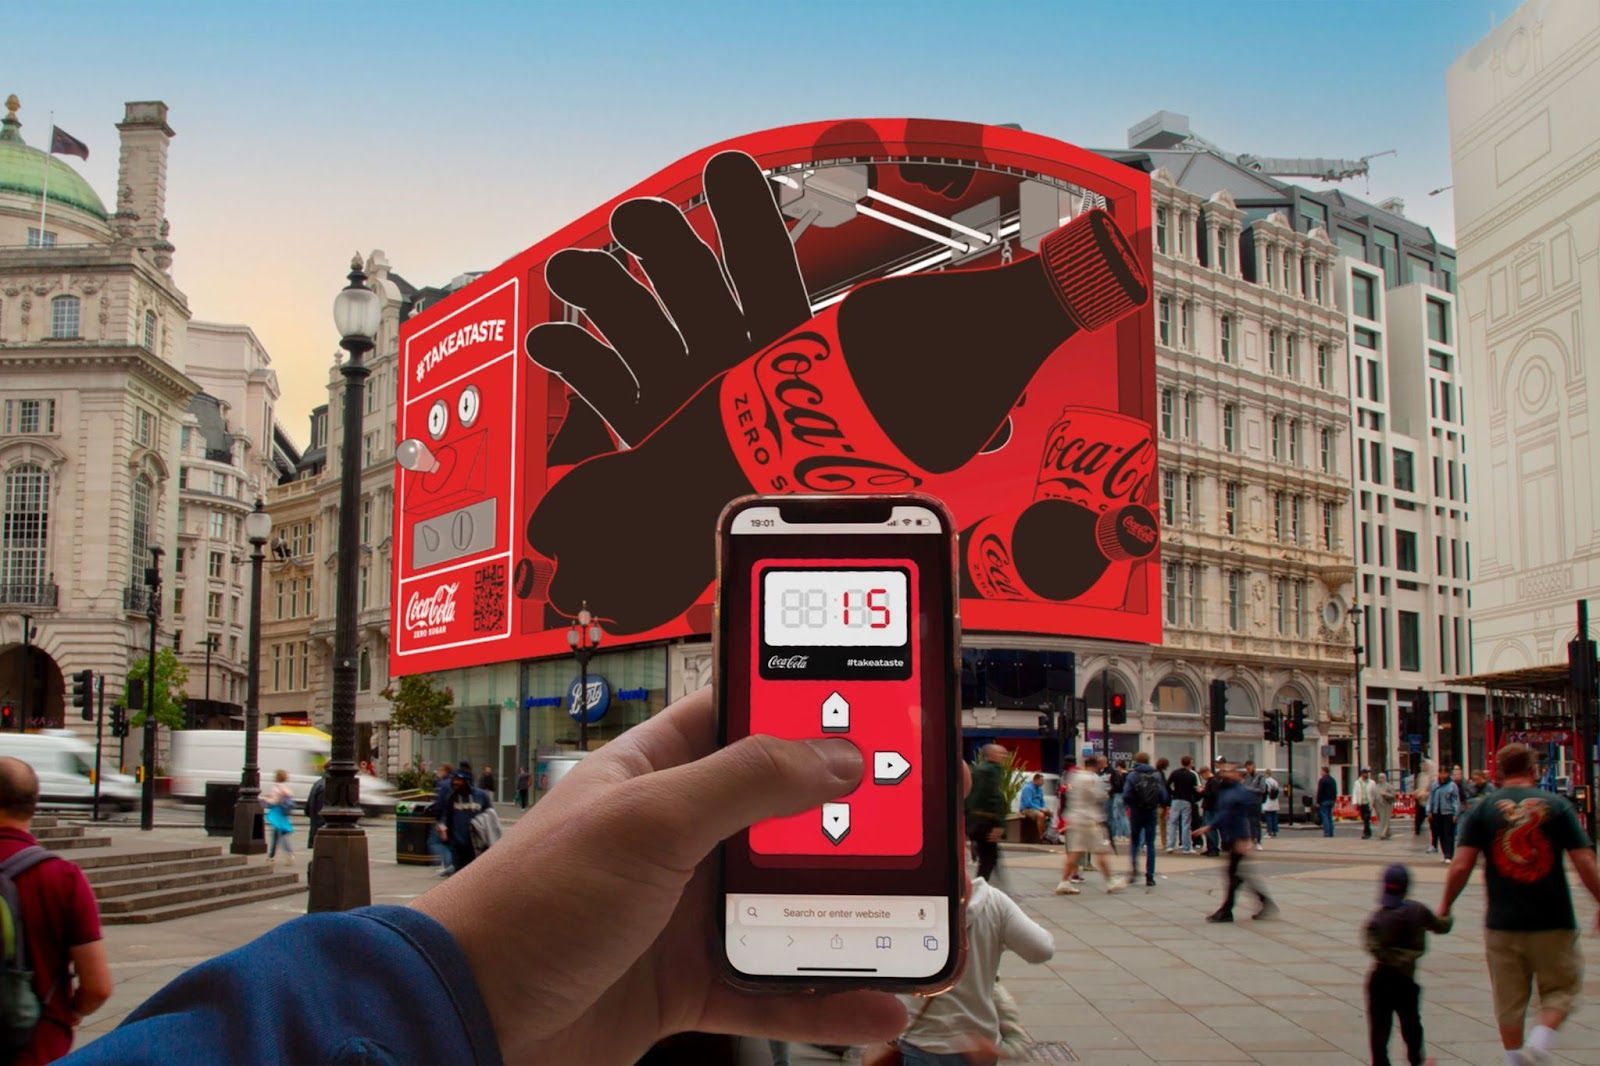
Web-based Augmented Reality (WebAR) has transformed how brands and developers deliver immersive experiences. By removing the need for dedicated apps, WebAR allows users to engage with interactive 3D content directly through their browsers. However, with this innovation comes the critical need to understand how users interact with these experiences. Analytics for WebAR is not just about counting views—it’s about unlocking valuable insights that drive engagement, optimize performance, and ultimately improve return on investment (ROI).
This article delves into the key insights you need to learn from WebAR analytics. We discuss the critical metrics, integration of traditional analytics tools, best practices for tracking and data collection, and emerging trends that are set to redefine the AR landscape.
1. Understanding the Importance of WebAR Analytics
WebAR experiences have grown from simple demonstrations to sophisticated, interactive advertising, retail, education, and entertainment applications. Understanding how users interact with these experiences becomes essential for refining content and maximizing engagement as the market expands.
Analytics enable brands to track a user's journey from the moment they encounter an AR activation (via QR codes, links, or embedded experiences) until they complete the experience. By analyzing this data, companies can:
– Identify drop-off points and adjust load times or visual content accordingly.
– Gauge user engagement through metrics such as dwell time and interaction rates.
– Optimize the spatial layout of 3D elements based on user behavior.
This detailed understanding leads to more effective campaigns and a higher overall ROI. As noted by industry leaders, measuring these metrics is fundamental to understanding whether your AR content resonates with your audience.
2. Core Metrics in WebAR Analytics
Unlike traditional web analytics, which focus primarily on page views and clicks, WebAR analytics introduces additional metrics that capture the immersive nature of the experience.
Pageviews and Unique Visitors
Much like any web experience, the first step is tracking pageviews. Every time a user loads the AR experience, a pageview is recorded. This basic metric offers insight into the initial reach of your campaign. However, to truly understand engagement, you must also track unique visitors to determine how many individual users are returning to the experience. These figures help assess the overall attraction of your AR content and inform decisions about re-engagement strategies.
Dwell Time
Dwell time measures how long users remain engaged with the WebAR experience. A longer dwell time typically suggests that the experience is engaging and that users are exploring the interactive elements. If an experience is designed to be immersive but users exit quickly, it may indicate issues such as long load times or unclear instructions. Optimizing dwell time by refining user interfaces and streamlining content is key to improving overall performance.
Engagement Rate
Engagement in WebAR is more nuanced than simple likes or shares. Instead, it involves tracking interactions with the 3D elements, such as rotations, zooms, and taps. Calculating an engagement rate—the ratio of interactive actions to the total number of views—provides a clearer picture of how compelling the experience is. A high engagement rate signifies that users are not only viewing but actively interacting with your AR content.
Spatial Analytics
The most distinct metric in WebAR analytics is spatial analytics. This involves tracking how users navigate within a 3D space. For example, spatial analytics can reveal which areas of an AR scene attract the most attention and which elements are overlooked. This insight is invaluable for adjusting the positioning of virtual objects to maximize impact. By understanding spatial behavior, brands can design more intuitive and engaging AR environments that guide user attention exactly where it’s needed.
3. Integrating Traditional Analytics Tools with WebAR
Traditional web analytics platforms like Google Analytics offer a familiar foundation for tracking standard metrics. However, integrating these tools with WebAR experiences requires some customization.
Leveraging Google Analytics
Many AR experiences now incorporate Google Analytics to track standard metrics like visits, unique visitors, and bounce rates. Developers can augment this data with custom event tracking to record interactions unique to AR. For instance, you can log when a user grants camera access—an important signal that the user is ready to engage with the AR environment. Custom events can also be used to monitor actions such as 3D object manipulation or navigation within the AR scene. These granular insights help determine which parts of the experience are most effective and which need further refinement.
Advanced 3D Analytics Platforms
Beyond traditional tools, specialized platforms such as Cognitive3D and Metalitix have emerged to provide deep insights into 3D interactions. These platforms capture metrics that traditional tools may miss, such as heatmaps of user movement within the AR space, gaze tracking, and real-time performance indicators like frame rates. With such detailed data, developers can conduct A/B testing to fine-tune the immersive experience and ensure that every element—from the positioning of virtual objects to the responsiveness of interactive elements—is optimized for engagement.
4. Best Practices for Tracking WebAR Analytics
As with any data-driven initiative, the success of your WebAR campaign relies on robust tracking and analysis. Here are some best practices to follow:
Establish Clear Goals
Before launching an AR experience, define success. Whether it’s increasing dwell time, boosting engagement, or driving conversions, having clear, measurable goals will help you determine which metrics to focus on. Clear goals also allow for more precise A/B testing and iterative improvements.
Implement Custom Event Logging
Custom events are the backbone of detailed WebAR analytics. Beyond basic pageviews, log every interactive event—camera permissions, object interactions, spatial movements, and even pauses in the experience. This data provides a comprehensive picture of user behavior, allowing you to identify specific pain points or successful elements within the experience.
Utilize Heatmaps and Spatial Tracking
Heatmaps are an effective way to visualize user engagement within a 3D space. By overlaying data on the AR environment, you can see which areas attract the most attention and which remain largely unexplored. Use this information to reposition elements, add call-to-action prompts, or simplify navigation to enhance the overall user experience.
Optimize Load Times
Load times are critical in immersive experiences. Delays can lead to user frustration and abandonment before the experience truly begins. Use analytics data to monitor the time it takes for the AR experience to load and make technical optimizations—such as compressing textures and reducing polygon counts—to ensure a smooth, responsive interaction.
Regularly Analyze and Iterate
Analytics is not a one-time task but a continuous process. Review your data regularly to identify trends, test different approaches, and make iterative improvements. Over time, these adjustments can significantly enhance engagement and overall performance. Data-driven decision-making allows you to pivot quickly in response to user behavior and technological changes.
5. Leveraging WebAR Analytics for Marketing Success
Understanding user behavior in AR is not only a technical challenge—it’s a powerful tool for marketing and brand engagement. Here are a few ways to harness the power of WebAR analytics to drive marketing success:
Enhancing User Engagement
By studying engagement metrics, brands can identify what elements resonate with users. For example, if analytics reveal that a particular interactive feature drives higher engagement, that element can be emphasized in future campaigns. Moreover, measuring the effects of various calls-to-action (CTAs) can guide the creative process for subsequent experiences.
Personalizing the User Experience
Analytics data allows for greater personalization. By understanding which parts of an experience users interact with the most, you can tailor future experiences to individual preferences. Personalized AR experiences can increase user satisfaction and drive repeat engagement, ultimately strengthening brand loyalty.
Improving Conversion Rates
One primary goal of many AR experiences is to convert engagement into tangible business outcomes, such as sales, sign-ups, or event participation. Marketers can refine their strategies by analyzing how users interact with key elements of the AR experience. For instance, if data shows that users who interact with a virtual try-on feature are more likely to purchase, this insight can lead to optimized product placements and enhanced visual storytelling in the AR campaign.
Storytelling with Data
The power of WebAR is its ability to tell a story in a way that traditional media cannot. Analytics help refine that narrative by showing which aspects of the experience captivate users. Marketers can use these insights to craft compelling stories that seamlessly blend digital and physical realities, creating memorable brand interactions.
6. Real-World Use Cases and Success Stories
Several brands have successfully integrated WebAR analytics to refine their experiences and boost campaign performance. For example, companies like Rock Paper Reality have leveraged WebAR analytics to measure metrics such as dwell time and spatial interactions, which in turn have informed design adjustments and improved overall user satisfaction.
Similarly, platforms integrating advanced 3D analytics have enabled marketers to track granular data such as heatmaps and interaction patterns within the AR space. These insights have led to significant improvements in user engagement and conversion rates across retail and education industries.
7. Challenges and Future Trends in WebAR Analytics
While WebAR analytics is a rapidly evolving field, it does face some challenges that need addressing:
Device Compatibility and Performance
Because WebAR runs on a range of devices—from high-end smartphones to more modest models—ensuring consistent performance is a challenge. Analytics can help identify which devices struggle with load times or interactivity, allowing developers to implement adaptive techniques such as dynamic asset quality adjustments.
Data Privacy and Security
As WebAR experiences often require access to camera feeds and sensor data, ensuring user privacy is paramount. Compliance with data protection regulations and the use of secure data collection methods are essential. Future trends may see more robust privacy features built into AR platforms, making it easier for developers to track analytics while safeguarding user data.
Evolving Web Standards
WebAR is built on emerging web standards such as WebGL and WebXR and evolving APIs for sensor data. As these standards develop, analytics methods must evolve as well. Future innovations are likely to bring even more detailed metrics—such as real-time gaze tracking or advanced spatial mapping—further enhancing our understanding of user behavior.
Integration with Artificial Intelligence
The integration of AI with WebAR analytics is an exciting trend. Machine learning algorithms can analyze large datasets to uncover patterns and predict user behavior. This improves the optimization process and opens the door to highly personalized AR experiences that adapt in real time to individual user interactions.
8. Conclusion: The Path Forward for WebAR Analytics
As WebAR grows in popularity and sophistication, analytics will remain at the heart of successful experiences. The key insights discussed—from understanding core metrics like dwell time and engagement rate to leveraging advanced spatial analytics—equip brands and developers with the tools to continuously refine their AR experiences.
Marketers can obtain a holistic view of user behavior by integrating traditional analytics platforms with specialized 3D analytics tools. This data-driven approach ensures that every element of an AR experience is optimized for maximum engagement and conversion. In a competitive landscape where every interaction counts, the ability to measure and act on user behavior is not just advantageous—it’s essential.
As technology evolves and more sophisticated tracking methods emerge, WebAR analytics will undoubtedly play an even larger role in shaping the future of digital experiences. The convergence of immersive technology, advanced data analysis, and AI-driven insights promises to unlock new opportunities for personalized and impactful brand storytelling.
For any organization embarking on a WebAR journey, investing in robust analytics is the first step towards creating engaging experiences and building lasting relationships with users. The insights gleaned today will form the foundation for tomorrow’s innovations, ensuring that your AR content remains compelling, efficient, and, above all, effective.
In summary, whether you are refining an existing campaign or launching a new AR experience, the key to success lies in understanding the nuances of user behavior. WebAR analytics provides the roadmap to create experiences that captivate and convert, from tracking simple pageviews to mapping complex spatial interactions. Embrace these insights and iterate based on data, and you will be well on your way to mastering the immersive future of digital engagement.
TALK TO A PRO
We're here to bring your brand to life!
Stay Connected with BrandXR
Create Augmented Reality for Free!
Create, Publish, and Measure 3D Augmented Reality Experiences Without Having to Code.