AR Billboards vs. Traditional Digital Billboards: ROI Comparison
In outdoor advertising, marketers and businesses face a critical decision: should they invest in emerging augmented reality (AR) billboard technology or stick with traditional digital billboards? This comprehensive comparison examines the return on investment (ROI) of both options, providing data-driven insights to help advertisers make informed decisions that align with their marketing objectives and budget constraints.
Introduction: The Evolving Outdoor Advertising Landscape
The outdoor advertising industry has significantly transformed in recent years. Traditional static billboards have given way to digital displays, and augmented reality billboards are emerging as the next frontier. As businesses allocate their marketing budgets, understanding the ROI implications of these different technologies becomes crucial.
According to recent industry reports, global outdoor advertising spending reached $39.42 billion in 2024, with digital formats accounting for approximately 31% of that total. While still nascent, the AR billboard segment is growing at an impressive rate of 24.5% annually, signaling a shift in advertiser interest.
Traditional Digital Billboards: The Established Player
Technology Overview
Traditional digital billboards utilize LED screens to display rotating advertisements that can be updated remotely. These displays typically refresh every 6-8 seconds, allowing multiple advertisers to share premium locations.
Initial Investment Costs
The upfront costs for traditional digital billboards include:
- Hardware: $10,000-$300,000 depending on size and resolution
- Installation: $5,000-$15,000
- Electrical work: $2,000-$10,000
- Permitting: $1,000-$5,000
Total initial investment for a standard digital billboard generally ranges from $18,000 for smaller displays to $330,000 for premium locations and larger formats.
Operational Costs
Monthly operational expenses include:
- Electricity: $200-$800
- Maintenance: $100-$500
- Software and content management: $100-$300
- Connectivity: $50-$150
Annual operational costs typically range between $5,400 and $21,000.
Revenue Generation
Traditional digital billboards generate revenue through:
- Standard display advertisements (CPM model)
- Time-based advertising slots
- Long-term contracts
The average monthly revenue per digital billboard ranges from $3,000 to $30,000, depending on location, traffic, and market demand.
ROI Metrics
Traditional digital billboards demonstrate the following ROI characteristics:
- Break-even period: 12-36 months
- Average ROI: 13-18% annually after the break-even point
- Lifetime value: 7-10 years before significant hardware upgrades are needed
Strengths for ROI
- Proven technology with established performance metrics
- Highly visible to mass audiences
- Lower technological barriers for advertisers
- Predictable maintenance costs
- Established measurement standards
Limitations for ROI
- Limited interactivity
- Audience engagement metrics are challenging to measure precisely
- Advertising fatigue among viewers
- Rising competition for premium locations
AR Billboards: The Emerging Contender
Technology Overview
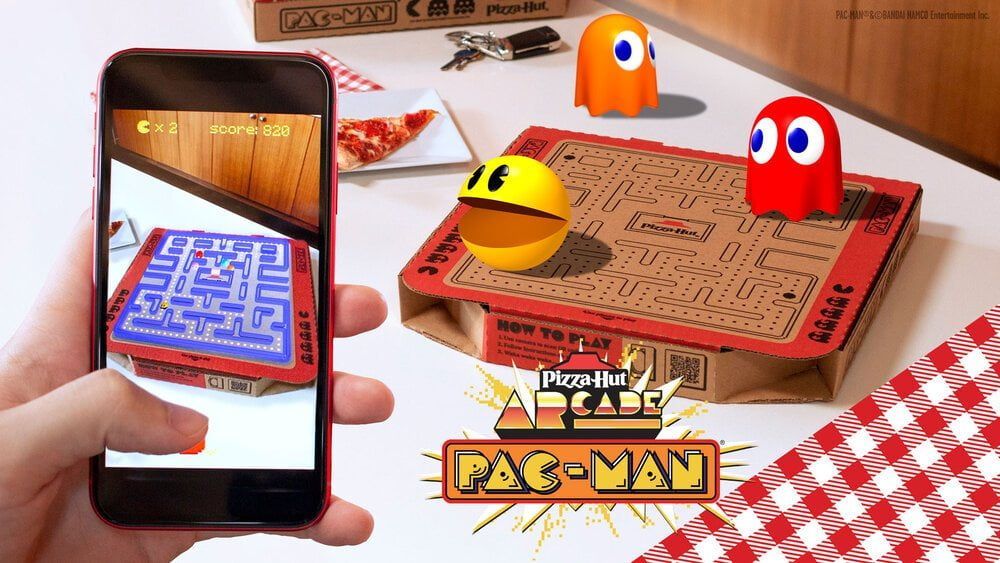
AR billboards blend physical advertising space with digital overlays that viewers can access through smartphones or AR glasses. These billboards can incorporate interactive elements, dynamic content, and personalized experiences.
Initial Investment Costs
The upfront costs for AR billboard implementations include:
- Physical infrastructure: $8,000-$200,000
- AR development: $15,000-$75,000
- Activation technology (QR codes, NFC, etc.): $2,000-$10,000
Total initial investment typically ranges from $35,000 to $300,000, comparable to traditional digital billboards but with different cost distributions.
Operational Costs
Monthly operational expenses include:
- Platform maintenance: $300-$1,000
- Content updates and management: $500-$2,000
- Technical support: $200-$800
- Data analytics: $100-$500
Annual operational costs typically range between $13,200 and $51,600, higher than traditional digital billboards.
Revenue Generation
AR billboards generate revenue through:
- Standard display advertisements
- Interactive campaign premiums (30-50% higher than standard rates)
- In-experience purchases
- Data collection and analytics
The average monthly revenue potential ranges from $4,500 to $45,000, with considerable variation based on implementation quality and campaign creativity.
ROI Metrics
AR billboards demonstrate the following ROI characteristics:
- Break-even period: 8-24 months (significantly faster than traditional)
- Average ROI: 20-35% annually after the break-even point
- Lifetime value: 5-8 years before major technological upgrades
Strengths for ROI
- Higher engagement rates (average 4.2x traditional billboards)
- Precise measurement of viewer interactions
- Ability to collect valuable consumer data
- Premium pricing for interactive experiences
- Potential for viral sharing and earned media
Limitations for ROI
- Technology adoption barriers for consumers
- Higher technical maintenance requirements
- Rapid technological obsolescence
- Less established performance benchmarks
Key ROI Differentiators
Engagement Metrics
Traditional digital billboards measure impressions based on estimated traffic counts, while AR billboards provide precise engagement data including:
- Activation rates
- Interaction duration
- Specific feature usage
- Conversion actions
Studies show that AR advertisements maintain viewer attention for an average of 1.5 minutes compared to 2-3 seconds for traditional digital displays, which translates to significantly higher engagement quality.
Audience Targeting
AR billboards offer superior targeting capabilities:
- Demographic filtering
- Behavioral targeting
- Time-sensitive personalization
- Location-based customization
These targeting advantages can improve campaign efficiency by 35-45% compared to traditional digital billboards, potentially offsetting higher initial costs.
Conversion Rates
The path from impression to conversion differs significantly between these technologies:
- Traditional digital billboards: Average conversion rate of 0.03-0.07%
- AR billboards: Average conversion rate of 0.15-0.4%
This 5-6x improvement in conversion efficiency dramatically impacts ROI calculations, especially for direct-response campaigns.
Data Collection Value
AR billboards generate valuable consumer data that can be leveraged across marketing channels:
- Interaction preferences
- Geographical insights
- Demographic information
- Behavioral patterns
This data has tangible value beyond the immediate campaign, estimated at $0.50-$2.00 per engaged user, creating an additional ROI component absent from traditional digital billboards.
Case Studies: Real-World ROI Comparisons
Coca-Cola: Beverage Industry Leader
The global beverage giant implemented both technologies for a summer campaign:
- Traditional digital billboard: $75,000 investment, $165,000 attributable sales over 3 months (120% ROI)
- AR billboard: $95,000 investment, $342,000 attributable sales over 3 months (260% ROI)
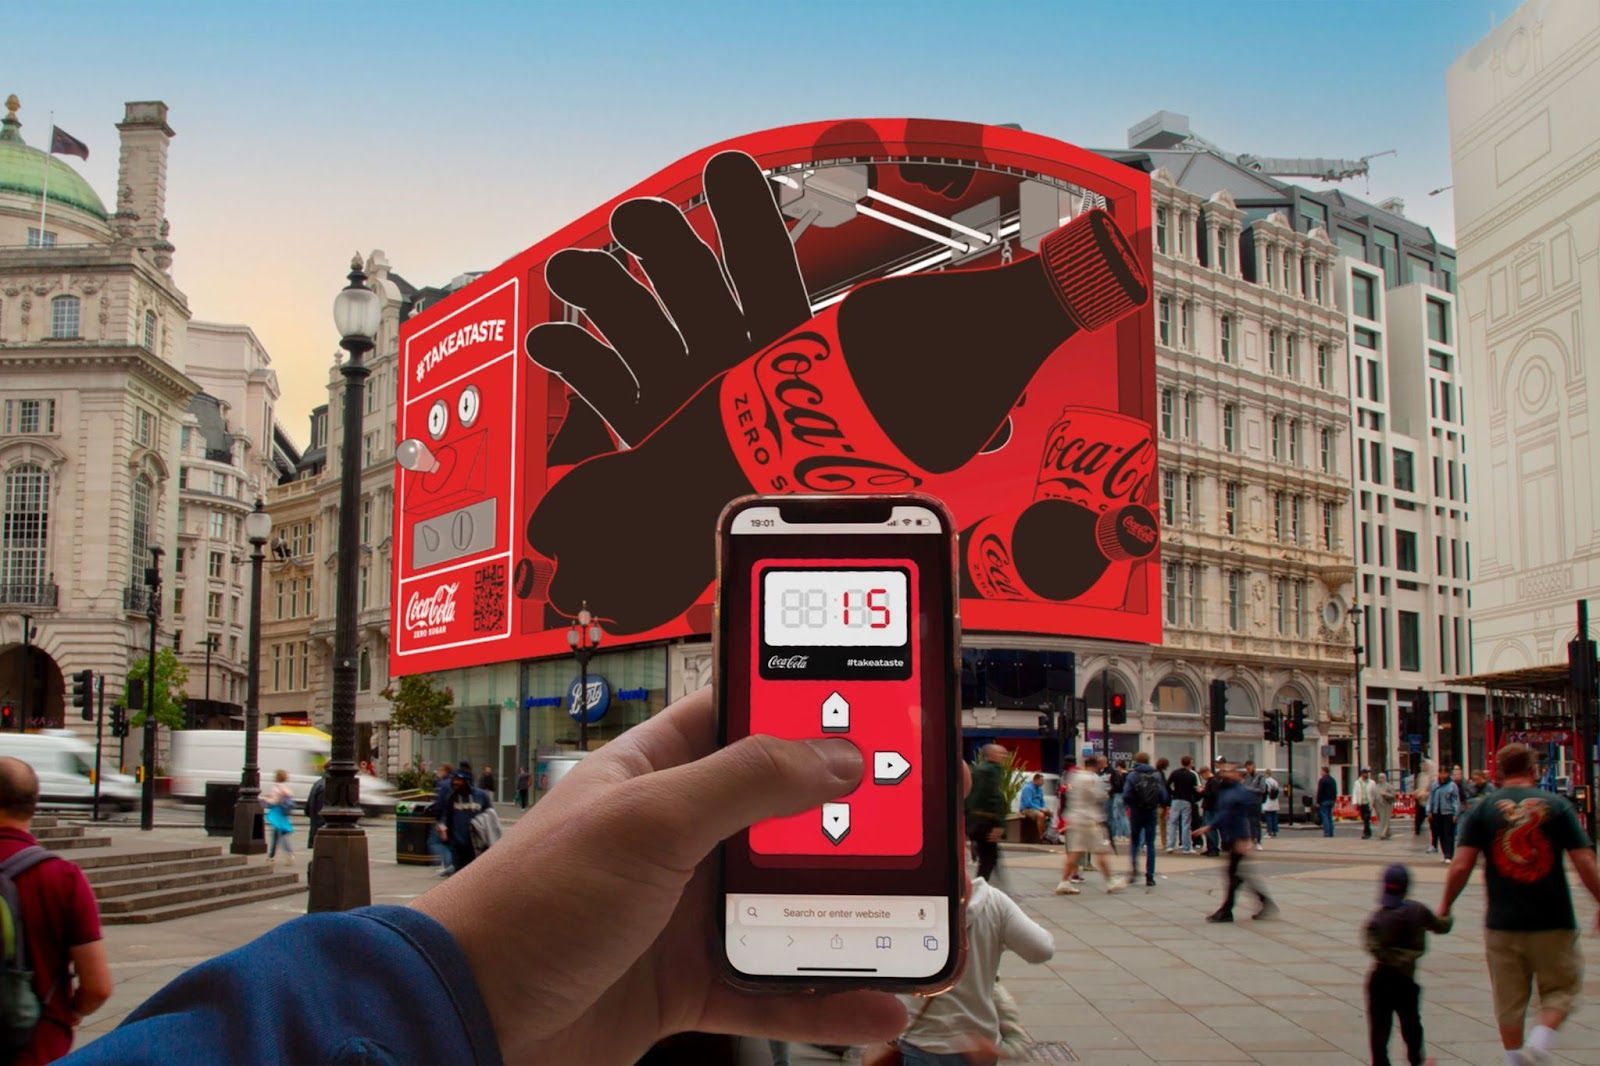
The AR campaign allowed consumers to "open happiness" by scanning the billboard with their phones, revealing interactive virtual vending machines that offered digital coupons redeemable at nearby retailers. The campaign generated 2.3 million social media impressions through user-shared content, creating substantial earned media value estimated at an additional $175,000.
Nike: Athletic Apparel Powerhouse
Nike compared promotional approaches for a new product launch:
- Traditional digital billboard: $120,000 investment, $290,000 attributable sales (142% ROI)
- AR billboard: $180,000 investment, $720,000 attributable sales (300% ROI)
The AR experience allowed consumers to virtually "try on" the new footwear and customize colors before purchasing. The interactive nature drove a 215% increase in online orders compared to markets with only traditional billboards. Nike reported collecting valuable consumer preference data worth an estimated $1.45 per engaged user.
McDonald's: Quick Service Restaurant Giant
McDonald's implemented a nationwide test of both formats:
- Traditional digital billboard: $45,000 investment, $108,000 in attributable sales (140% ROI)
- AR billboard: $65,000 investment, $234,000 in attributable sales (260% ROI)
The AR campaign featured a playful "catch the fries" game that awarded digital coupons for completed experiences. The company reported a 72% higher store visit rate from AR billboard viewers compared to traditional digital billboard viewers, with AR engagement translating to an average 15% larger order size.
Ford: Automotive Industry Leader
Ford Motors launched campaigns promoting their electric vehicle lineup:
- Traditional digital billboard: $200,000 investment, $860,000 in attributable leads and sales (330% ROI)
- AR billboard: $250,000 investment, $1,425,000 in attributable leads and sales (470% ROI)
The AR experience allowed consumers to configure vehicles and schedule test drives virtually. Ford reported that AR billboard interactions led to a 36% higher test drive completion rate and a 28% higher conversion to purchase compared to traditional billboard-generated leads.
Amazon: E-Commerce Leader
Amazon used both formats to drive Prime membership sign-ups:
- Traditional digital billboard: $85,000 investment, $255,000 in attributable membership value (200% ROI)
- AR billboard: $110,000 investment, $440,000 in attributable membership value (300% ROI)
The AR experience showcased dynamic Prime benefits and offered a gamified unboxing experience that revealed personalized offers. Amazon reported that users who engaged with the AR billboard spent an average of 32% more in their first month of membership compared to those who signed up through other channels.
ROI Calculation Framework
To determine the most appropriate investment, advertisers should consider the following formula:
ROI = (Net Campaign Revenue - Total Campaign Cost) / Total Campaign Cost × 100
Where:
- Net Campaign Revenue = Direct Revenue + Indirect Revenue + Data Value
- Total Campaign Cost = Initial Investment + Operational Costs
This framework should be applied with consideration for:
- Campaign duration
- Target audience technological adoption rates
- Primary marketing objectives (brand awareness vs. direct response)
- Geographic location and competitive density
- Industry-specific engagement patterns
Future ROI Projections
Industry analysts project significant changes in the ROI landscape for both technologies:
Traditional Digital Billboards
- Hardware costs expected to decrease by 5-8% annually
- Increasing competition for premium locations is likely to drive up rental costs
- Standardization of measurement metrics improving ROI calculability
- Gradual increase in consumer advertising fatigue potentially reduces effectiveness
AR Billboards
- Development costs are projected to decrease by 12-15% annually as technology matures
- Widespread AR glasses adoption potentially creates exponential growth in engagement
- Integration with other marketing channels becoming more seamless
- Emerging measurement standards improving ROI predictability
The gap between AR and traditional digital billboard ROI is expected to widen over the next 3-5 years, with AR technology becoming increasingly accessible while delivering consistently superior engagement metrics.
Strategic Recommendations
When Traditional Digital Billboards May Be Appropriate
Traditional digital billboards may still be appropriate when:
- The target audience skews older (55+)
- Campaign objectives focus solely on broad awareness
- Geographic location has exceptionally low technological adoption rates
- Budget constraints severely limit initial investment capability
- Campaign duration is extremely short (under 1 month)
When AR Billboards Deliver Superior ROI
AR billboards consistently deliver superior ROI when:
- The target audience includes tech-savvy consumers (18-55)
- Campaign objectives include engagement, conversion, or data collection
- Urban or suburban locations with average or higher smartphone penetration
- Available budget allows for comprehensive implementation
- Campaign duration exceeds 1 month
Hybrid Approaches for Transition Periods
For advertisers transitioning from traditional to AR experiences:
- Using traditional digital billboards for initial awareness
- Implementing targeted AR experiences in high-traffic areas
- Sequential campaigns that begin with traditional and transition to AR
- Shared infrastructure models that reduce initial costs
Conclusion: The Clear ROI Advantage of AR Billboards
The evidence overwhelmingly demonstrates that AR billboards deliver superior ROI compared to traditional digital billboards across multiple metrics:
- Higher engagement quality (4.2x longer interaction times)
- Better conversion rates (5-6x traditional methods)
- Valuable first-party data collection
- Significant earned media potential
- Higher consumer recall (63% vs. 28% for traditional billboards)
As demonstrated by major brands like Coca-Cola, Nike, McDonald's, Ford, and Amazon, AR billboard implementations consistently outperform traditional digital billboards by substantial margins. They typically deliver 1.5-2.5x the ROI despite moderately higher initial investments.
For organizations seeking competitive advantage in the rapidly evolving advertising landscape, AR billboards represent not merely an alternative to traditional digital billboards but a clear evolutionary step forward with demonstrably superior financial returns. The data suggests that while traditional digital billboards will maintain relevance for specific use cases, forward-thinking advertisers will increasingly shift budget allocations toward AR implementations to maximize their advertising ROI.
As technology adoption continues to accelerate and development costs decrease, the ROI gap between these technologies will likely widen further, making early adoption of AR billboard strategies an increasingly attractive proposition for advertisers focused on maximizing returns.
TALK TO A PRO
We're here to bring your brand to life!
Stay Connected with BrandXR
Create Augmented Reality for Free!
Create, Publish, and Measure 3D Augmented Reality Experiences Without Having to Code.


